LABKAR is a lab analysis service offered by the accredited petroleum lab PAL, founded under the roof of Middle Eastern Technical University (METU) in Ankara. They ask other labs from all over the country to send in their measurements in response to samples sent out by LABKAR. The data is then aggregated, analyzed and turned into a report where each lab
can see how accurate their measurement was.
The process looks like this: ship out samples to participating labs, allow labs to send their measurements back, perform tests on the same sample as a baseline and once all the data comes in from other labs, perform highly scientific and tightly controlled calculations on them, finally generating reports with the results.
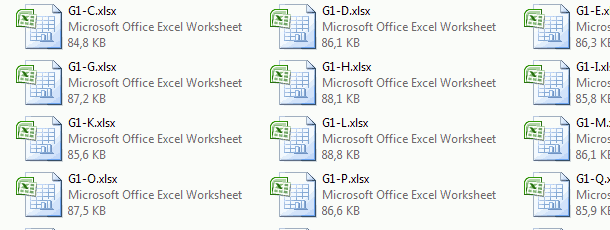
These reports sometimes run up to 200 pages and every single line must show accurate data, without any mistakes or typos. When the stakes are so high, a manual process is out of question as it introduces human error into the scene. LABKAR used Microsoft Excel, Microsoft Access and myriad small tools to get the task done, with their data fragmented across several computers as individual .xls and .doc files. They handled each report as a team, where each person would work on a certain set of analyses, after which all the results were put together. They cross checked each other’s work
and transferred their data to Microsoft Access so that they can populate a Word template.
However, even after so many steps, they had to manually insert charts and other information into the final PDF because Microsoft Access could not handle their corner cases well enough, such as chart labels or scientific rounding of
numbers.

Custom Report Generation Software
We had several meetings with LABKAR where we analyzed their entire process, and it became clear that they already had their data recorded in a database. What they needed was an app which could accurately run the calculations for them, but more importantly generate the reports, which took weeks to put together manually.
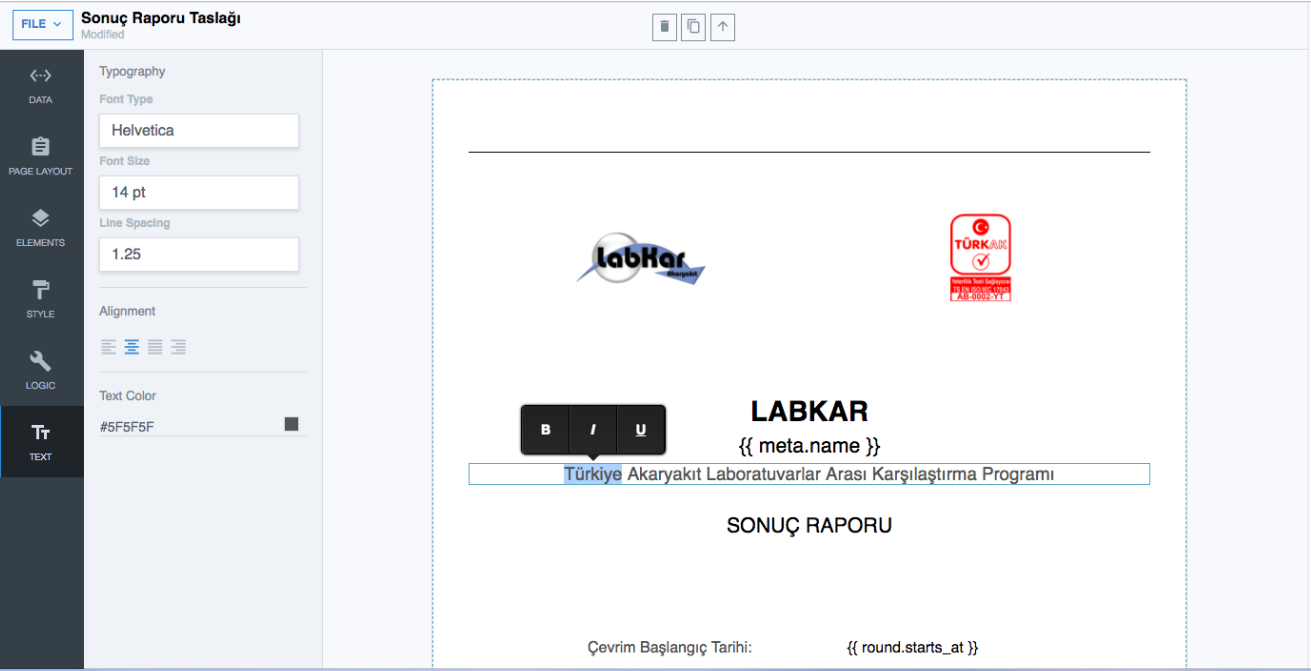
The templates of these reports had to be editable rather than being hard-coded so that they can make changes to text and formatting on their own, without having to turn to us. Furthermore, the calculations could also change as instructed by higher institutions who set the standards such as TürkAK (Turkish Accreditation Agency) and ISO, so hey wanted to be able to see and control how the calculations are done, as well.
The first piece of the puzzle that we reached for was our own open source software Swiftdocs. Swiftdocs is a drag and drop dynamic document builder written in Vue.js. This client-side tool is quite versatile as it can be easily extended with custom plugins and modified to fit any document needs. In LABKAR’s case, we had to develop custom chart plug-ins which can be inserted into the document to display lab analysis results as bar and scatter charts.

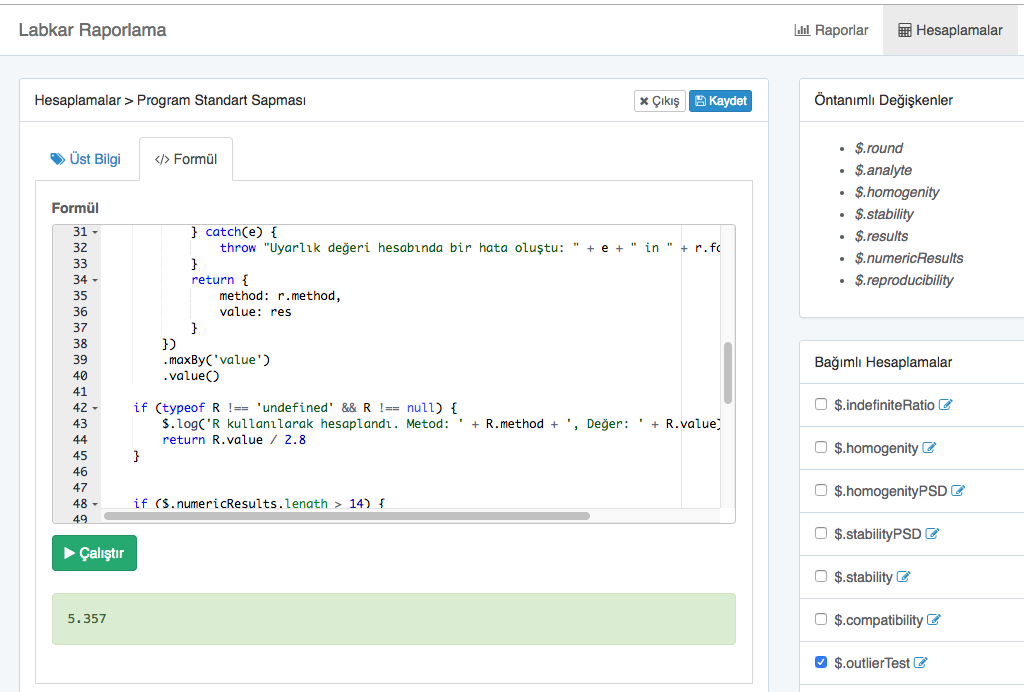
With a dynamic and versatile document builder in place, now we actually had to pull data in from their database and run calculations on them. As we mentioned earlier, they wanted control over this so we opted for Laravel + V8JS extension for PHP. We used Laravel to create the backend where they can manage their reports, and V8JS was used to enable LABKAR employees to create, view and modify the calculation algorithms in Javascript code.
We created a calculation framework where they can individually manage each calculation, mark them dependent on others to control execution order and a playground where they can test the code against existing data in read-only mode. It’s also capable of logging for debugging purposes and error handling capabilities (throwing an exception causes other dependent
calculations to fail).

As a result, LABKAR is now able to generate their reports with the click of a button and they save hundreds of hours of work per report.
Do you have laborious manual processes at work similar to this? If so, feel free to get in touch and we’ll be happy to discuss ways in which your processes can be automated by custom software.
